I know, I know, I’m cynical — but yes, we can probably start out by responding to that headline question with a “probably not.”
But that doesn’t mean we don’t care what they’re talking about in this latest ad — this time, the pitch comes from Jimmy Mengel for his The Crow’s Nest letter — it just means that we’ll look at it dispassionately, without letting our emotions take over and dangle dreams of yachts and Ferraris (and a secure retirement, and college for the kids) out in front of us on a stick like a yak-herder with a carrot. No, you’re not going to turn $10,000 into a million dollars in three years unless you’re really good at poker (and lucky) — and certainly the idea that you can do so while only buying “blue chips” and just being smarter than everyone else is absurd.
So toss that ridiculous promise aside, think to yourself about whether this strategy might help you to get slightly better returns… or about whether you find the stocks that are being teased by Mr. Mengel interesting or worthy of further research. Let’s set the bar low and think for ourselves, shall we?
The basic spiel is a thinly-veiled pitch for doing market timing using some variation of what’s usually called the “Fed Model” … but let me pull a few little sections from the ad so you can get a sense for yourself:
“… we’ve all been conditioned to think safe companies can’t pay the same huge returns as smaller, riskier companies. Some people even call blue chip stocks ‘boring.’
“But as you’ll see over the next few minutes, that’s simply not true.
“In fact, everyday investors are already becoming ‘blue chip rich’ in as little as 36 months… no matter their current savings or investing pedigree.
“And it’s all thanks to a secret formula — one that takes ordinary blue chip stocks and boosts their profit potential by as much as 10 times.
“Here’s the thing (and this might surprise you)…
“This has nothing to do with…
- Buying and holding for decades, compounding growth and dividends.
- Chasing the next Microsoft or Apple, looking for that home-run winner.
- Or using risky (and complicated) strategies like options or penny stocks.
“That’s because with the formula I’m about to reveal to you, none of these will work.
“It’s actually preferable to use blue chip companies”
So, this formula lets you make 10X as much profit from “blue chip” stocks? And you’re not using options or anything leveraged like that? Hmmmm.
Here’s a bit more…
“I’m talking about a mathematical approach to the stock market that’s nearly 42 years old.
“But despite being nearly half a century old, few people have ever heard about it.
“In short, it’s a way to pinpoint exactly when the market is peaking and exactly when it’s hit rock bottom.
“It gives you the chance to avoid the fundamental error so many traders make on a constant basis: poor timing. They trade with their hearts instead of their heads.
“When things are going well, few people think about selling. And on the flip side, when things are bad, most investors are scared to buy.
“But of course, it’s easy to say you need good timing — it’s another thing to actually have it.
“And that’s where the formula I’m telling you about today comes in.”
And he implies that this “formula” — despite its simplicity — is not being used by folks on the Street because your broker doesn’t want you to know about it…
"reveal" emails? If not,
just click here...
“See, even as some of the biggest firms on the Street are making money hand over fist thanks to this formula…
“They’ve told their clients to do the exact opposite.
“Why?
“It’s simple: When you hold an investment over a long period, the fees accumulate for managing your money. So your broker gets absurdly rich… while you get slaughtered when the market drops.”
I don’t think that’s true. Brokers and investment managers have an inherent bias toward action, not advising “hold over a long period” — they earn commissions and/or justify their existence when you do something. Investment managers who manage portfolios for people don’t care whether you buy or sell on a given day, they earn their fixed percentage as a management fee and their only incentive is to grow the assets under management (either by getting new customers or by growing the size of their customers’ accounts, or preferably both), but brokers, who exist to sell stocks and process transactions, only get paid when you do something.
But anyway, what’s the big idea here?
The “formula” they’re touting is just basically the calculation of the risk-adjusted return of investments — you compare the earnings yield of stocks to the yield on long-term bonds, and the difference is the “risk premium” or the amount of money you’re “earning” by taking a chance on a non-guaranteed investment.
The basic comparison of the S&P earnings yield (the inverse of the PE ratio, so a PE of 25 would mean that stock is “earning” 4% on current equity) with the 10-year or 30-year government bond yield is common, and sometimes this is referred to as the “Fed Model” — though the Federal Reserve didn’t come up with it, and I have no idea whether their analysts and economists use this simplistic tool. The idea is, when stocks are cheap (the earnings yield is substantially better than the yield on Treasuries) you should buy stocks, and when stocks are expensive (the earnings yield is nearly as low as, or lower than, risk-free treasuries) you sell stocks.
There’s great argument about the utility of the “Fed Model” in general, and, indeed, quite a bit of debate about exactly which numbers you should be using (which bond yield, forward versus training S&P earnings, etc.) and what changes in this “risk premium” are meaningful (ie, do you buy when stocks yield two percentage points more than bonds? One point? Five points? Do you sell when that threshold is breached or when the lines cross on the chart?). There’s no real consensus, and few people are actually believers in the utility of the “Fed Model” as a strict timing indicator for buying and selling.
Which isn’t to say that it’s pointless — the basic idea that the model represents, the difference in the amount of return you get from taking a risk with stocks versus playing it safe (or so you think) with government bonds, is critical. Obviously, when government bonds yield 10% the stock market should have a high hurdle — if you can earn 10% without taking real risk, how much do you have to envision earning to make it worthwhile to take risks?
Unfortunately, most interpretations of the “Fed Model” that I’ve seen didn’t necessarily give clear signals for when it was best to get out of and (this is critical) get back in the market. If you look at various charts that show the S&P earnings yield versus the 10-year Treasury Note yield you can see that the last time Treasuries yielded more than the market was during the dot-com bubble, so they were giving a pretty significant “signal” that bonds were a better buy than stocks in 1999 and 2000, and then, after the crash, that stocks became a better buy in 2003 or so… but the moves since then for the crash of 2007-2009 and the various smaller moves are much less definitive — and for smaller moves that don’t come close to those 2001 or 2008 crashes, the model seems to offer no real help at all. Over the last year, the earnings yield and the 10-year yield have basically been moving in lockstep — both have moved lower, but the gap between them remains about the same (right now it’s about a 5.5% earnings yield from stocks, a 2% yield from the 10-year note).
What does this mean? I have no idea. Interest rates have been almost incomprehensible over the last seven years because of the massive global effort to drive down interest rates through stimulus and the flight of huge amounts of capital away from perceived currency and economic risk around the world and into the US dollar. And risk has maybe never been higher in bonds in our lifetimes than it is now, what with the continuing drive toward what appear to be unsustainable fiscal models in pretty much every government on the planet and the fact that the 30-year-old bull market in bonds (as interest rates have declined, almost without respite, since the early 1980s) is so old and tired that it makes our six-year bull market in stocks look like a little puppy.
The “Fed Model” seems to me to be a useful general tool for thinking broadly about whether the market seems cheap or expensive, and in retrospect it gave some good indications in 2000 and 2008-9, but it’s not necessarily a great short-term indicator in any given month and I have a hard time believing that anyone is trading in and out of stocks and bonds based primarily on the “Fed Model”… or that anyone doing so is going to miss all the bear markets and hit all the bull markets in the future.
But the rest of the pitch does make more logical sense — my understanding of what they’re saying is, “pick out a few blue chip stocks, and be ready to buy them if and when the market crashes again… which it might well do before too long.” People have turned blue in the face waiting for market crashes before, but having the mentality of a bargain hunter when crashes do come will generally serve you well. Here’s how they put it in the ad:
“Back in 1987, everyone thought things were rolling along great. Then Black Monday hit, and millions went bankrupt as they lost all they had.
“The same thing happened in 2000 and 2008. And it’s going to happen again at some point… probably sooner rather than later.
“But the crazy part is that these market crashes were actually good news for those investors who knew about the opportunity we recently uncovered…”
So… he goes on to say that it’s not the actual “Fed Model” that they’re following, it’s a variation that uses corporate bond yields instead of treasuries. Which doesn’t make much sense to me as a measure of relative risk, but does at least give numbers that are more likely to cross from time to time (the 10-year treasury yield has only crossed above the S&P Earnings yield a couple times in modern history), and he says this signal is infallible…
“If you compare the earnings yield to the rate of AAA corporate bonds, you get a deadly accurate marker for market tops and bottoms.
“That’s the signal used by Wall Street’s biggest hedge funds and banks.
“Unlike the Fed’s model — which has missed some big calls — this formula has hit the bull’s-eye for the last 80 years.
“In 1929, for instance, the corporate bond yield was almost 6%, while the earnings yield fell to 5%.
“This precipitated the greatest market crash of all time.
“Then, in 1932, at the Great Depression market bottom, the earnings yield skyrocketed to 11%, even as the corporate bond yield fell to under 3.5%.
“This HUGE buy signal could have handed you some of the biggest returns in financial history.
“That’s why most hedge fund analysts follow THIS version of the Fed’s model.”
Well, we can run that chart — look at the AAA corporate bond rate and the S&P 500 earnings yield and the S&P 500 returns, and this is what you get:
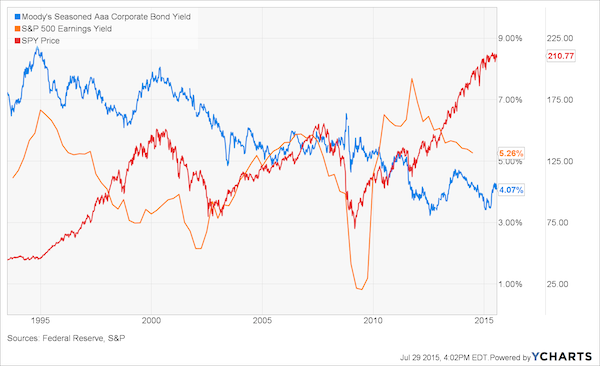
I dunno, that doesn’t look all that actionable to me, even in retrospect. I guess if you were going to buy and own stocks only when stocks had an earnings yield that was higher than AAA yields then you would have avoided losing money in the two largest crashes of the last few decades, but you would have only owned stocks for a couple years out of the last 20 — you didn’t own stocks in the 1990s or at all until about 2004, then you owned them until the yield crossed lower in 2007, when you sold, only to buy again in 2010, which you’re still holding and waiting for those lines to cross again — which they will before too long if the current trend continues (will it? Probably not, nothing is that simple).
And you know, maybe it’s a decent indicator that you’d want to consider for your asset allocation tweaks — but no one relies on just one indicator or puts all their trust in it, particularly when that indicator, at least on the most basic level, has only give three or four signals in 20 years. Is that a trend, or an anomaly? It’s reasonably logical, I suppose, but I don’t think that many mathematicians or statisticians would agree with you if you said that something that correlated with good returns even a half dozen times over 80 years is necessarily highly predictive. It’s a tool, a way of thinking about broad market valuation — and that’s about it.
If you want to think about what it means for sentiment, you might bring it down to individual examples — in the heart of the last crisis, from late 2008 to early 2010, you could choose to invest in Verizon either through their highly-rated bonds or through the stock. The stock had a dividend yield (not the “earnings yield”, but actual cash dividends) that was higher than the yield on the corporate bonds for much of that time period. I bought Verizon shares at the time, partly just because it seemed idiotic not to do so — that kind of anomaly shouldn’t exist unless people think the world is coming to an end. Usually, at times like that you’re too scared to act on logic like that — and I almost was, too — but being prepared for such eventualities is probably good for you.
So if you use the tool in that way, trying to use it to give yourself a sense of whether everyone is thinking that the world is ending and you might have the opportunity to buy something cheap as a result, well, more power to you.
Should we consider the stocks that Mengel thinks will be opportunities when the next crash hits and brings that earnings yield back to near or over the bond yield? well, let’s at least name ’em for you — here are the clues:
“2015 Market Crash Winner #1: 980% Potential Gains
“The first play I’m tracking now is a Fortune 150 company based out of Charlotte, North Carolina.
“It’s America’s second-largest steel producer, with a market cap of $14.4 billion.
“It grew its earnings by 50% last year. And it’s projected to double its earnings by 2016.
“That means it could hand you 140% gains for no reason at all.
“What’s more, this company has a proven track record of managing market swings.
“And that’s why this is a huge market rebound winner in my book.
“I’m talking about potential 1,000% gains easily.”
I don’t think I’ve ever seen a newsletter tease that said “buy the next time there’s a crash, then you’ll make huge gains” … but that seems to be what Mengel’s saying, and he’s looking at that next Fed interest rate decision in mid-September as the time when you want to start being ready.
But what his this first potential “Crash winner?”
Thinkolator sez this is Nucor Steel (NUE), which is actually now America’s largest steel producer (they overtook US Steel last year).
And yes, you would have saved some heartache if you had sold NUE in 2007, when the S&P 500 earnings yield dipped meaningfully below the AAA bond yield, and bought back in the Spring of 2010 when that situation reversed. It didn’t tell you much about how to nimbly get in and out of NUE’s other moves during those years, but it would have been better than just buying and holding NUE for the whole period.
Will that happen again? Man, I have no idea. Earnings estimates are for a forward earnings yield on the S&P of about 7%, so if those estimates are correct (they probably aren’t, but they’re better guesses than I have) then the AAA bond rate would have to stage a huge increase in order to trigger that particular signal, the AAA corporate rate hasn’t been that high since 2002. I don’t doubt that corporate bond yields will rise over time, but I doubt that they’ll rise that dramatically even if the Fed hikes rates — if I did think long-term rates were going to jump that high, that fast I’d certainly get out of all of my income-oriented investments, because REITs and MLPs and many high-dividend stocks will get clobbered if AAA bond yields go to 7% before the end of the year.
Another one?
“2015 Market Crash Winner #2: 1,000% Potential Gains
“My next play is a Columbus, Indiana-based engine maker with a $31 billion market cap.
“Founded in 1919, this Fortune 500 giant is a global leader in manufacturing diesel engines and power generation systems.
“Over the last five years, it’s enjoyed incredibly strong average earnings growth of 15%, mostly thanks to surging demand for its auto components throughout North America, Asia, and Europe. And it’s expected to outpace this growth over the next five years.
“That’s why an independent evaluation based on Warren Buffett’s buying criteria ranked this company a number one buy out of industrial stocks.
“What’s more, this firm has a proven track record of handing investors life-changing returns during market rallies.
“For instance, after the Tech Wreck of the early 2000s, this company skyrocketed for 1,120% gains.”
This one is, sez the Thinkolator, Cummins (CMI), the big diesel engine manufacturer. The stock bumped up a bit this week after a good earnings report. Certainly a good company, has been very cyclical in the past and is probably being held back a bit by soft growth overseas — it’s not terribly expensive right now, probably because of growth fears.
Another?
“2015 Market Crash Winner #3: 418% Potential Gains
“The next play on my radar is a Minneapolis-based bank founded in 1901.
“And although I doubt 99% of investors have ever heard of it, this is America’s fifth-largest bank with over $263 billion in deposits.
“However, unlike Bank of America or JP Morgan, it’s a regional lender. And it focuses mostly on the Midwest.
“This is one of the few banks that could have survived the 2008 crash without a bailout.
“It’s one of the ONLY banks that never posted losses during the crisis. Even as most banks lost their shirts, it remained profitable.
“That’s why, within two months of the market bottom, it soared for 132% gains.”
This one’s USB. It did not soar for 132% gains within two months of the market bottom in March 2009, not unless there was some crazy intraday trade well below the closing prices on those days, though it bounce back pretty fast — and did rise that much (perhaps a bit more) over the next year or so. A very solid bank, I happen to prefer PNC (PNC), the similar-sized super-regional bank, but that’s partly just because I can get nice cheap leverage on PNC using TARP Warrants — Warren Buffett owns USB, and you’re probably better off following him than following me.
How about one more?
“2015 Market Crash Winner #4: 2,000% Potential Gains
“Founded in 1851 with a market cap of $30 billion, this next major blue chip company is one few investors know about.
“It’s the world’s leader in ceramics and glass manufacturing.
“Not the sexiest sounding industry, I know.
“But its products are vital for the production of portable computers, fiber-optic cables, and scientific research equipment.
“Now, it’s a shame this play is so ignored by most investors.
“Because it has delivered phenomenal gains following market downturns.
“After the 2002 crash, for instance, it handed investors 1,967% returns.”
This must be Corning (GLW), which has indeed had a few nice runs over the years — though I’d argue that they’ve largely been driven by just a couple trend “stories” in their earnings, and because of the big swings in those few businesses they’ve been one of the more concentrated, story-driven major companies in the world. They had their first big spike to a ridiculous valuation into the dot-com crash because of their sales of fiber-optic cable (that’s when all that “dark fiber” was laid without any customers in place, the stuff that folks like Google bought up years later), then a huge run as flat-screen TV production went all-out with the HD conversion, and a smaller bump up as Apple turned them into a iPhone/iPad story when they chose Gorilla Glass (though they still make a lot more of their money from TV glass than anything else). I’ve always liked Corning, but I wouldn’t consider them much of an economic bellwether or a guaranteed winner just because stocks dip in some hypothetical future crash — if they’re going to spike in the months to come, it will be because of a lot more sales of TVs (they keep hoping that UltraHD or 4K HDTV will bring another upgrade wave, as 3D failed to, but it hasn’t happened yet)… or perhaps some new invention that hasn’t hit yet.
They are reasonably priced right now with a PE in the 10-11 range, but they’re not expected to grow earnings or revenue by more than a few percent over the next couple years so they could easily stay “reasonably priced” for a long time.
So… there you have it, four stocks that Jimmy Mengel thinks will present 1,000%+ buying opportunities… but not necessarily right this minute, you apparently have to wait for the “Fed Model” or something similar to flash a “buy” signal. I’m a bit skeptical that these four stocks particularly will do better than the S&P 500 in the immediate aftermath of some hypothetical crash that creates a general buying opportunity — and it depends greatly, of course, on what the prices are for these particular stocks that that hypothetical future point in time. But they aren’t terrible stocks, at least, and I suppose they count as relatively obscure (compared to Pfizer, GE, JP Morgan and Coca Cola, at least) mid-cap blue chip-type stock ideas.
Any of that sound interesting to you? Do you agree that we should be looking for a signal from the AAA Corporate yield and the “risk premium” (or lack thereof) represented by the S&P 500 earnings yield? Have some other “crash! Buying opportunity!” signal that you prefer or are watching? Let us know with a comment below.
Travis, the “Fed model” is worse than useless when it comes to understanding the stock market. It isn’t just simplistic, it’s wrong. Please see the very thorough work of John Hussman on stock market valuation. The right metrics are the Shiller CAPE, the Tobin Q, and a modified version of Warren Buffet’s market cap/GDP. Price to revenue is a much better metric, for example, because earnings are erratic and need to be normalized by long-term smoothing.
All indicate the market is quite seriously overvalued and still has not fully worked off the excesses of 1998-2000. For more, see Ed Easterling’s work on secular stock cycles at Crestmont Research.
The Fed model only gets taken seriously because Greenspan was enamored of it, leaving it with some lingering (and undeserved) prestige. He liked it because it helped him and others rationalize the overvalued markets of the late 90s and mid-2000s as not bubbles. That’s an era that should be remembered, but mainly for its delusions.
I suspect that pretty much all the models will have trouble being at all accurate in this bizarre and often counterintuitive market — though many of them will have at least some merit because lots of traders follow them, I suppose. The Fed model is nicely logical because it’s just another way of saying “money goes where it’s treated best,” but I’m not betting anything on it’s ability to tell me where the market will be in a year.
Still, at times when the market seems richly valued its always worth it to do some preparatory work: if everything falls by 25 percent, what is it that I want to be buying then? If you plan for it, it might be easier to make those buys when the rest of the world is panicking. Whether that’s next month or next year or in five years, good to be at least a little bit mentally prepared.
Great article and follow-up comment, Travis. Thanks.
Has anyone read “2020”? What are the options before the “fit hits the shan”?
This formula looks like an extant of the O’Higgins one, first published by Michael O’Higgins in 1999, inappropriately titled “Beating the Dow with Bonds”. His premise was to only buy in January of each year and re-evaluate annually, buying either stocks or bonds depending on the earnings yield. In my own back-test of this, it would have kept you in stocks from 2005 to the present, even through the crash of ’08. If you had bought 10-year treasuries in Jan 2005 and held to maturity, you would have had a 42% gain (interest). If you had bought a unit of the S&P 500 and held the same time, you would have gained approximately 100%, including dividends. So the formula works, sort-of. However, if you had bought the Jan 2005 treasuries and had the presence of mind to sell them in Jan 2013 and put all of the original investment plus gains into units of the S&P, you’d have a gain of about 260% for the 10 years. Not bad, even by Buffett standards. I guess they call it the “Fed model” because somewhere along the line they discovered it and are using it to manipulate the markets as they wish. So we’ve had “operation twist” and zero interest rates world-wide and the stock markets are booming as expected, on the backs of us old people. But they have all painted themselves into a corner…they can’t raise rates anywhere without creating a real tacky mess. So now Ms. Yellen now uses words and “leaks” of future Fed actions in an effort to keep a lid on valuations, while using employment figures to alibi their not taking the action that they know would be a disaster.
Great article thank you.
The Fed model doesn’t work. The same 100% gains after the crash could have easily been made by purchasing Vanguard index funds after the crash.
I am familiar locally with Corning. It is a solid company with an interesting history, but I don’t think you are going to see an earnings bonanza coming from them.
Gorilla glass is their big earnings generator. A few years ago Corning made a 400 million or so investment into 2 plants to build ceramic particulate filters for diesel engines. A new plant in New York and a renovation of a mothballed fiber optic plant in Europe. They have a deal with Volkswagen for the filters on some diesel cars. Otherwise there is very little news. Corning frustrates me when they report earnings as I can’t find the breakdown in to sales and profits on products. They only report divisions.
Sir John Templeton used to have a wish list of stocks that he wanted to own that were expensive. He would wait until a market correction to buy them. That is basically this advice. If anyone thinks there is going to be a crash, keep enough assets in cash to buy the bargains when it occurs.
Thanks again for the article, I enjoy your detective work!
I am 20% cash, 60% equities and 20% corporate debt right now.
Mengel’s pitch seems so exciting but Travis’ excellent rebuttal reminds us to be very careful not to invest in newsletter writers’ fanciful ideas!
alb forgets that the “Crows Nest” is supposed to give you a superior view, that the premise.
However, I like his conclusion; indeed it seems copywriters are pulling out all the stops to make the most outrageous claims ever, to say nothing of endless and mindless repetition. Read a promo this morning for Outstanding investments by Matt Insley, (who I used to like) promoting what he calls “Apollo’s Energy” but this endless pitch shows the desperation most publishers must be facing trying to get new subscribers. Things are pretty bad in the industry if it takes an hour video of redundancy to promote a $99. subscription discounted to $49. with a 360 day money back guarantee to try and sell a newsletter.
Speaking of Jimmy Mengel’s Crows Nest put out by Angel Publishing, to which I subscribed years ago but was surprised by a renewal charge months after expiry on my Visa i did not authorize. They denied my account showed a subscription to Crow’s Nest and I am getting a run around trying to get a refund. Couldn’t get through on the phone, so am reduced to E-mail In researching a fax number for Angel Publishing to send a photocopy of my credit card statement to PROVE they charged me for something not authorized and not being delivered, I came across a “Angel Publishing COMPLAINTS file on the Internet which came up with 440,000 complaints registered, so buyer beware with this outfit.
For irregulars, Travis can you add a search space?thanks
I spent 20 minutes researching the stocks after watching the trailer and came up with the same ones above – so proud of myself! Lol! the trailer he also mentioned a healthcare REIT – pretty sure it’s Ventas, Inc VTR. Thoughts on that one?