A question from a reader today echoes the sentiment that I’m hearing from a lot of other folks, so I’m going to run with it… and that will lead me into looking at a teaser pitch for a bearish options trading service. Here’s the question:
“I’m a believer in an impending crash. What do we do with our investments? If it’s big enough for deflation, then gold and other things will go down too, correct?”
You can scroll about halfway down if you just want to skip to the teaser solution bit, but I’ve got some ranting and bloviating to do first.
The first thing we have to say in answering that is that question is that no one is sure, and that crashes, deflation, and recessions don’t always come all together in one package, or for the same reasons as the last crash.
We have not had any meaningful level of deflation in the United States since the Great Depression (though some would argue that point), and it’s hard to judge the impact of deflation on gold because the US Dollar was still backed by gold then (gold prices were reset by FDR through gold confiscation, partly in order to create inflation and generate “stimulus,” which are otherwise hard things to do under a gold standard… but the gold price didn’t fluctuate in the market like it does now).
The best-known gold mining stocks of the time, Homestake and Dome, posted massive returns coming out of the 1929 market crash, doing far better than the broad market, so we know there was some fervor for gold stocks even during the deflationary period of the early 1930s… but I don’t know if that means deflation caused the enthusiasm for gold stocks (the gold business was also fundamentally far different at the time — their costs were crashing because of deflation and high unemployment, but they had a set selling price for their produced gold because of the gold standard).
You’ll see these examples, particularly Homestake, trotted out by pundits when they want to argue that gold will soar during deflation… and it might, but that’s really a guess (and it probably depends, at least in part, on the cause of the deflation). Many of those pundits seem to be using their base assumption, that deflation will mean a loss of confidence in the currency (a currency that most ardent gold fans think should have lost global confidence 40 years ago), and extrapolating that belief to predict that people will hate dollars in deflation, and will rush to gold to protect their assets. This is certainly a possible outcome, but I don’t think you can assume it’s the only likely outcome — we really don’t know. It’s also quite possible that gold will follow the logical path of other commodities during deflation: Dollar becomes more valuable, people hold dollars and demand for most things erodes, commodity prices fall. “Commodity prices falling” is, after all, the root cause of several periods of deflation we’ve had in the past, and gold is special… but it’s also a commodity.
It might just be that the reason for deflation matters a lot — the depression of the late 1920s and early 1930s was caused, at least in part, by banking failures and bank runs, but the deflation started before the depression, particularly because of falling prices for agricultural commodities that crushed the rural economy. Rural America was in a depression for a decade before the “Great Depression” hit, and that was part of what drove people to the cities to participate in (or at least go to look for) the “roaring 20s.” So that was oversupply causing deflation, too much corn and wheat and cotton was produced as farms expanded, partly to meet the demands of WWI, and then farmers kept producing more as demand dropped. The deflation we saw during much of the 19th century was caused more by productivity growth (industrialization and improved agricultural yields). Prior deflations were caused by lots of things — the forced discipline of the gold standard when that was adopted in the 19th century by a few countries, etc. etc.
What will the next deflation be caused by? Just “not enough money?” Money supply can be shrunk, of course, if interest rate rises or continued regulatory pressure on banks make lending shrink… but that seems an unlikely cause to me, because central bankers are so worried about deflation that they’ll continue to print more money or take interest rates lower (or negative) to try to boost the money supply.
So I think there has to be another reason. Maybe just global stagnation or recession that causes everyone to sit on their hands, maybe we finally go through a big period of deleveraging when everyone has to pay their debts for the past 30 years of global largesse… but those are things we only really understand in retrospect. They’re really, really hard to forecast with any precision — hard even if you’re an economist trying to get a handle on 10, 20, or 50 year cycles, probably all but impossible if you’re an investor trying to figure out what will happen in 6-18 months.
Deflation just means “falling prices” — the same way that inflation means “rising prices.” It means that each dollar you’re holding in cash gets more valuable, that the purchasing power of that dollar increases each day — so the tendency is to hold on to the cash, because you think prices will fall tomorrow. That destroys economic activity, because consumers and investors hold back and wait — and capitalism requires a steady stream of people who want to buy products and invest in productive assets, without that you have no chance for growth. The risk is that falling prices create desperation for the asset owners and the companies who are trying to sell to consumers, so prices fall further, wages fall, and deflation gets worse in a spiral into long-lived economic depression.
That, really, is what keeps the central bankers up at night — they know how to stop inflation, all you do is slow down the economy and create more friction by raising interest rates. It hurts, but the mechanism works and is fairly simple. But stopping deflation is much, much more difficult… and the best tool they have, cutting the cost of debt to inflate the value of assets, may not work as well to inflate prices and inspire economic activity as it does to inflate asset values (as we’ve seen over the past seven years) — and even that option is really no longer available now that debt has been made ridiculously cheap after seven years of near-zero interest rates.
That’s why central bankers are willing to push negative interest rates in Europe and Japan right now, despite the fact that we don’t really know what negative interest rates will do to a big economy: They do know what deflation does to a big economy, and they’re terrified of it and willing to try crazy things to try to stop it. Including, effectively, threatening people that if they don’t spend their money it will be confiscated (which, really, is what a negative interest rate means — negative interest rates are just another way, like FDR’s gold confiscation, to try to force more activity in the “real” economy by punishing savers).
I try not to fool myself that I have a great ability to predict the future — so far, there has been little evidence that my sentiments about the broad economy or markets have any sway on the path of events, or any predictive power. It is humbling, of course, to admit this — but I just don’t know (it’s OK, I get humbled every day — I’m used to it). Which means I try really, really hard not to bet too heavily on any one outcome even if I’m sure that it must be inevitable. In my relatively brief 20 years as an investor, lots of things that I thought were logical and inevitable have failed to happen… that’s the core reason for one of my basic investing principles, that it’s important for most investors to diversify away from ourselves to avoid overweighting whatever fear or sentiment we might have about the world or the markets — because overweighting your own sentiment will crush your portfolio if it turns out that your feelings really weren’t a clear indicator for what the future would bring.
I don’t say that to be rude or dismissive of whatever your opinion or sentiment might be — you can feel, as I do, that something bad is likely to happen given the big imbalances in our economy and the oversupply of problems in the world, and you can back that up with lots of data. We all can. But we’re human beings, and the one thing we really know about investing is that we tend to be our own worst enemy — we feel most pessimistic just when it’s time to buy, and we feel most optimistic just when it’s time to sell.
That hard-wired tendency is very difficult to overcome for most of us, and, to make it worse, our brains are clever enough to feed us just what we need to fortify and rationalize that feeling that we already have, so we don’t even think it’s a feeling or an opinion or a sentimental interpretation — we think it’s the obvious truth… and you always bet on the obvious truth, right?
The main reason Warren Buffett is such a successful investor is not really that he’s smarter than average, a big part of the reason is that his brain is wired a little differently. Whether because of his analytical bent and his confident awareness of his own shortcomings, or his stubbornness, or just the fact that he’s in Omaha instead of in Manhattan, or spends his leisure time playing Bridge instead of watching his portfolio tick up and down on a computer screen, he doesn’t feel the same overwhelming psychological urges to buy and sell at the worst time that burden the rest of us.
Sorry, I go off on a screed on that point from time to time.
To come back to earth, I do think that tweaking your portfolio to prepare for bad things is wise, and that there’s something to be said for positioning yourself to be ready, particularly when the market is at above-average valuations, interest rates are at all-time lows, political and geopolitical uncertainty are high. That doesn’t mean that most of us should go overboard.
It makes sense to step back, rethink risk levels, and be a little prepared for market crashes and deflation (which don’t always go together) in a few different ways, to hedge a bit, and to remind yourself of the “risk management” strategies that make sense for you and your portfolio but that might have been conveniently forgotten during this long bull market… but it doesn’t make sense to me to risk much of your portfolio betting that you’ll be right about the precise timing or extent of the next bear market (or deflation).
That’s because protection against falling markets and protection against inflation is pretty expensive for folks who want “real” insurance that protects a large part of the rest of their portfolio — and “protection” that just means you get to feel good because you hedged in the right way and your portfolio fell 38% in a crash instead of 40% is not necessarily all that valuable if you don’t have a high degree of certainty that you’re hedging the right way (and if you have that certainty, you’re well ahead of me). It’s a fairly thin path to tread, finding “protection” that is meaningful enough in size and scope to be worth the effort, but inexpensive enough to not constitute a big “bet” that will really harm your portfolio if you’re wrong.
And, of course, we should also keep in mind that though our fears about deflation are tied to fears of a global economic stagnation or collapse, there are “good” kinds of deflation… when new technologies bring more productivity and improve our lives, that causes deflation because the chair you bought for $500 five years ago can now be bought for $300. That doesn’t mean it always works out well for everyone, and sometimes these productivity-driven deflations have brought with them trade wars as less-productive countries close their borders to cheaper products, but deflation does not necessarily have to be accompanied by depression (or even recession).
So what are the possible strategies if you’re just worried about the market in general, whether because of specific deflation fears or overvaluation or politics or whatever else?
You could short some stocks, short the broad market or some sector through ETFs, buy gold or silver (or leveraged gold and silver speculations, like miners), or, particularly if you have time to absorb some losses, just hold a bit more cash than usual when market valuations are relatively high, like now, and wait for the sale prices to come when the market comes down… keeping in the back of your mind that it might come down in three years or five years instead of in six months.
That last one, “holding cash,” is likely to be the least expensive and speculative, and has a certain logic to it if you think deflation is a real possibility — in times of deflation, cash is king. But it’s not that exciting.
And I think that if you specifically fear the potential of a deflationary spiral hitting in the next few years, investing with Prem Watsa at Fairfax Financial (FFH.TO, FHFHF OTC in the US) is likely to be a solid bet that will perform much better than its peer insurance companies. Fairfax will likely offer some hedging against both deflation and market crashes because of Fairfax’s derivative bets on falling CPI and their overall bearish equity exposure. That’s why I suggested Fairfax as my idea of the month for September — not because I’m sure that we’ll have deflation, but because I wanted a relatively easy way to hedge against it, even just a little, with relatively little real hedging cost… and, I can let you know today, I have finally added a smallish Fairfax position to my personal portfolio. I think the valuation is still defensible here, though it’s more richly valued than some of their insurance competitors, and it offers a pretty unique bearish hedge for a company that also is a successful insurance operator and is profitable on an operating basis before you consider the impact of their investment portfolio.
But, to illustrate my point about the cost of hedging, a 5% position (just an example) in Fairfax will not fully protect your portfolio if the market falls by 30%. It will make the impact smaller, I expect, and it comes without a huge cost because the operating company is probably about as fairly valued as any others in the industry right now, but Fairfax shares are not likely to rise by 500% if the market falls by 30%.
The more aggressive way to hedge, without as much risk or capital required as you’d have with shorting individual stocks, would be to do what several relatively new newsletters are promoting right now: Pick some stocks you think will be disasters and buy long term out-of-the-money put options on them.
That is relatively expensive, but it will probably work well if we go into a real bear market well before your puts expire (you can buy LEAP options on many optionable companies now going out to January 2019, so you can get some longish-term exposure… at a price), and if you pick stocks that do worse than the market during a collapse. The leverage can be huge on these, so a 5% position in this kind of hedging could conceivably protect a portfolio that’s 95% exposed to the broad market… but a 5% position in a bunch of options contracts that have a high probability of going to zero means you’re risking 5% of your portfolio with what are generally considered to be pretty bad odds (at least by conventional thinkers — your opinion may differ). Fairfax shares have almost no chance of going to zero, absent a scandal or fraud, but for out-of-the-money put options “going to zero” is the most likely outcome… even if you assume that the put options you choose are on stocks that fall at least as much as the market during your anticipated market crash.
That’s the nature of leverage — take bigger risks to get bigger gains (or, in this case, pay a higher price to get more downside “insurance” exposure).
The argument from many of these pundits is that you want to bet against stocks with terrible financials — which makes perfect sense, but logic and “perfect sense” don’t necessarily apply if you’re just buying puts on one or two companies that look bad, or over a set time period in the markets. At that point, if you’re betting against three companies making huge moves down over a one or two-year period, I’d argue that you’re mostly dealing with luck — if you want to bet against 50 overpriced companies, then you’ll probably do well if your criteria are reasonable and the market is relatively weak for the next year or two leading into your options expiration… but if you bet against three companies, are you confident that they won’t rise on big positive news (or even on something irrational), or that the market won’t consider them to be way more valuable than you do?
My sentiment would have been to short Amazon at $200, Tesla at $100, or Netflix at $60, just to pull a few examples of companies that had awful financials at some point over the last five or six years and looked horribly overvalued, and I would have lost all my money if I had bought put options to add that sentiment to my portfolio (I was very wrong about Amazon, in particular, for a very long time — I would have also bet against it at $40 ten years ago, though thankfully I never traded on that assessment, not even when Amazon’s Z-score almost went negative back in 2014). And remember, there were plenty of folks in 2012, and 2013, and 2014, who were confident that the bull market and the recovery from the crash were over… but just since December 31, 2012 the broad market is up 50% and those stocks, which were indeed overvalued and ugly looking on the financial side by many metrics, are up dramatically more (AMZN up 230%, TSLA 485%, NFLX 660%). The lesson from that could be either that “we’re due” for a crash, or that people guessing at the timing of a crash are terrible guessers. I’d stick with the latter, even though I do think the markets are overvalued.
What does the options pricing tell us about the risk of a crash? You’re probably familiar with the VIX, which is a measurement of volatility that the CBOE calculates from options prices (to oversimplify: if call and put option prices are higher, that means options buyers are expecting bigger moves in stock prices). There’s another measure, called SKEW, that specifically looks at the “tail risk,” the options pricing for options that are well out of the money and outside the “normal” range of expected returns.
SKEW basically measures the likelihood, based on the behavior of buyers and sellers who are trading CBOE options, of “black swan” type events that move the market very sharply. That’s most evidenced by options traders buying put options that are way out of the money, speculations on what’s usually called either black swans or “tail risk” — the low-likelihood but high-impact events that can crash markets. This doesn’t mean that SKEW always has predictive power, necessarily, but it’s a gauge of “big risk” sentiment the same way that odds in a horse race are a gauge of which horse is likely to win — the people who follow it most closely bet more on the best horse, so the price of betting on that horse goes up. The favorite doesn’t always win, but going by the wisdom of the well-informed crowd is, we think, better than guessing.
And SKEW is, surprisingly to me, right about in the middle of its long-term range right now. The CBOE explains it thusly:
“Similar to VIX®, the price of S&P 500 tail risk is calculated from the prices of S&P 500 out-of-the-money options. SKEW typically ranges from 100 to 150. A SKEW value of 100 means that the perceived distribution of S&P 500 log-returns is normal, and the probability of outlier returns is therefore negligible. As SKEW rises above 100, the left tail of the S&P 500 distribution acquires more weight, and the probabilities of outlier returns become more significant. One can estimate these probabilities from the value of SKEW. Since an increase in perceived tail risk increases the relative demand for low strike puts, increases in SKEW also correspond to an overall steepening of the curve of implied volatilities, familiar to option traders as the ‘skew’.”
Over the past five years, that SKEW index has ranged from about 110 to 150, but it is almost exactly at the five-year average now, near 125. So there is some probability that the range of outcomes for the S&P 500 does not match what you’d expect from a “normal” distribution… we’re not in a period of complacency, I’d argue, but neither are we in a period of “panic” about that “tail risk.” The last time a clear “panic” hit the SKEW was the Brexit vote, which is the only time in 20+ years that SKEW has gotten over 150. Here’s what the chart of SKEW looks like for the past decade:
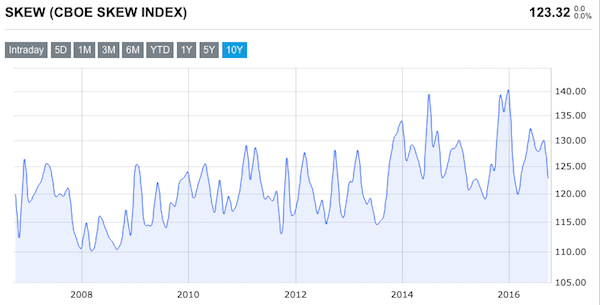
And here’s what CBOE puts up for the SKEW from 1990-2015:
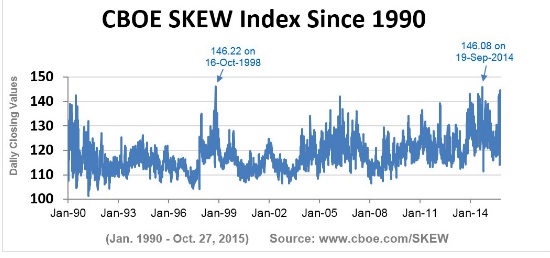
So you can see that there’s perhaps some mildly predictive indicators for bad stuff — the SKEW rose from 2004-2007 or so during the housing bubble, and in the few years before the internet bubble got out of control, but there’s not necessarily any predictive power about the markets as much as there is a pretty good correlation, perhaps, with sentiment and fear. And right now, surprisingly enough, prices on “black swan protection” options should, on average, be a bit lower than they were during the most worried parts of 2014 and 2015, and certainly cheaper than they were during the immediate aftermath of the Brexit vote… so that’s something. Maybe it’s just because the market has been relatively flat over the past 18 months (absent those two dips, in August 2015 and at Brexit, both of which were recovered quickly).
Of course, any “cheapness” to these out-of-the-money put options that might be implied by that average in the SKEW measure is probably easily overtaken by any market imbalances caused by, for example, a couple high-circulation newsletters recommending trades on the same options contract.
And on that note, I thought I’d take a look at the teaser pitch for one of those newsletters today — it’s called the Zenith Trading System, run by Michael Lewitt for Money Map Press.
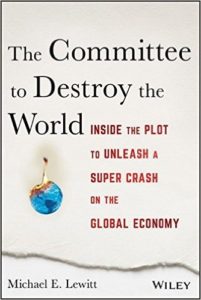 Just so you know you’re in good “find the downside” company, Lewitt published a book this Spring that was called The Committee to Destroy the World: Inside the plot to unleash a super crash on the global economy (I haven’t read it). He has been a credit markets advisor for some time, and published his Credit Strategist newsletter for 15 years before getting picked up by the much more promotional Money Map folks and coming to the attention of everyone in the US with an email address.
This is a bit from his recent ad:
“For the first time in my life, I’ve decided to share my personal method for transforming America’s worst companies into quick five and six-digit windfalls, with like-minded people who are as fed up with the supposed ‘bullish’ stock market as I am.
“Fed up with the mass manipulation of our so-called “leaders”…
“The chronic incompetence of the Fed and its hobbit leader Janet Yellen…
“And the greed that oozes from the pores of every broker and money manager out there.”
Sounds like fun, right? People who are wishy-washy don’t sell books (or newsletters).
More:
“The stock market is filled with incompetent money managers and financial analysts.
“All of whom are PAID TO LIE…
“Here’s the truth.
“Most stocks don’t go up. They go down.
“And here’s the proof:
“In 2015, roughly 65% of all stocks showed ZERO returns… most dropped faster than a ton of bricks off the Empire State Building.
“In Q1 2016, approximately 93% of investors LOST money with stocks – the ones they were coaxed into buying.
“And so far this year, 2,263 businesses are on the verge of bankruptcy, which is about 25% of all publicly traded companies.”
That must be based on the Z-score from Robert Altman — he found that companies with a Z-score of 1.8 or lower were likely to go bankrupt within two years. That 2,263 number is pretty close, and a company’s z-score can certainly change, right now the number, according to YCharts, is 2,152 just among the stocks on major US exchanges. That’s almost a third of the 7,100 or so US-listed stocks on major exchanges, so I think we can be pretty confident that the Z-score is not going to be perfectly predictable this time — those may be substantially weaker than other stocks, but they’re not all going to go bankrupt. The average number of public US companies declaring bankruptcy per year is somewhere in the neighborhood of 80-90 over the past decade, though that number hit 200 in the heat of the financial crisis.
More:
“… when it comes to making big money in stocks…
“Targeting bad companies is one of the smartest things you can do.
“Why?
“Because these stocks are PREDICTABLE.
“You know exactly what direction they are going in.”
And then we get a lot of claims from Lewitt not about what he did do in trades, but what his system would have recommended if he had traded it in the past… there are a dozen or so examples, all of companies that went from highfliers down into the dumps over some undisclosed time period, this is the kind of language he uses over and over:
“… my tests show that I would have known
“… my strategy would have told me with 94.5% certainty….
“I would have known how to make 4,844% gains in 11 months.
“In September 2014, I would have known with 94.5% certainty that this stock would soon deteriorate FAST”
He was, of course, around back then — he just wasn’t flogging a mass-market newsletter. I don’t know if he was trading like this or not, but he doesn’t indicate that he actually made or recommended any of these “94.5% certainty “trades… perhaps he hadn’t yet identified the perfect formula.
And yes, it turns out, he does rely heavily on the “Z-score” — here’s some more from the ad:
“The Z-Score reveals the inside details that CEOs like to keep close to their chests.
“This one number tells you whether a company can pay off its debt or not.
“For most people these little details mean absolutely nothing.
“For me, they mean EVERYTHING.
“It is a company’s vital sign… its heartbeat.
“The lower the Z-Score, the closer a company is to flat-lining.
“Historically, if a company had a Z-Score below 1.8, it was toast.
“For 31 years this is how Altman was able to detect – with 82% to 90% accuracy – which businesses were on the verge of bankruptcy.”
He gives a bunch of examples, but one stands out — he notes that Penn West Energy (PWE, now called Penn West Petroleum) had a share price above $20 and saw its Z-score fall to 0.87… and the stock it fell down to $1, turning his hypothetical investment from $2,500 into $126,734.
And the general thrust of that is true — PWE did go from $20 down to below $1. But it took seven years — and there were a few big moves in there, including a rebound when the stock fell to $8 or so and then shot back up to $16. The Z-score did trend down for a decade, but it’s hard to say it was predictive here over any short period of time because the price often led the Z-score down… and even if it was predictive, it wasn’t necessarily a way to make those kinds of absurd amounts of money on 10-18 month options contracts. That would have taken some pretty nimble trading, even for a stock that was on a pretty consistent downward trend for almost ten years.
I’d be comfortable relying on the Z-score as one part of assessing the credit risk of a company, which is how it’s used, but I’d want to do a lot more research before using it to predict that a stock will fall by a specific amount over a specific time period, which is what Lewitt’s selling in his recommendations to buy puts on bad stocks.
More from the ad:
“Thousands of U.S. businesses should technically be pronounced dead, but are haunting the landscape like zombies.
“They are being kept alive – or in a state of suspended animation – by 0% interest rates.
“But this is exactly why a Z-Score of less than 1.8 no longer cuts it…
“What used to be considered a distressed business is the new norm.
“That’s Why I Now Hunt Stocks with a Z-Score of Zero or Less.
“This is the equivalent of a company with the lowest junk bond rating.”
OK, so we cut that Z-score down to size — that makes the universe far, far smaller.
And he also notes that he does repeated, cycling options trades — buy a put option, take profits (hopefully) at some point to roll that capital over to a put option with a later expiration date, and so on to ride the stock into the dirt. He calls these “carbon trades”
“I recommend executing what I call a “carbon trade.”
“This allows you to take a “carbon copy” of the worst stocks on the market and repeatedly extract thousands of dollars from them by making the same exact trade over and over again.
“And remember, I will do these carbon trades on stocks that I know have a 94.5% chance of dropping in price.
“This way, as these stocks are in free fall, I can repeatedly collect hordes of cash. ”
“If the stocks goes down in price by the amount you expect it to, you win.
“If it doesn’t, I’m not going to lie – you lose money. However, you never have to lose more than what you put in. That’s the price you pay to make big profits, and you shouldn’t be investing if you’re not comfortable with that risk. But you can rest assured your loss is limited.”
The Z-score is a little tricky to use as a major indicator, since it doesn’t necessarily work all that well with different industries or as a way of making fine distinctions among peer companies — he cites Deutsche Bank (DB) as one where he has “already shown investors 244% gains,” and that’s certainly possible, as you’re probably aware DB has been dropping steadily since 2013 and has been in the news a lot lately as a festering disaster of a bank that will have to be bailed out… but the Z-score actually rose from 2014 into early 2016 even as the stock was falling. Perhaps the indicator of the Z-score did, as Altman intended, provide some evidence of a higher likelihood of bankruptcy in two years, but similar or worse Z-scores also afflict a lot of banks that are in far better shape than Deutsche Bank… like US Bancorp, Wells Fargo, Goldman Sachs, etc. So it’s clearly not a mechanical process of just looking for a low or falling Z-score and jumping on board with a short trade.
So he says he looks for stocks that have four criteria — negative Z-score, current ratio below 1, price to sales above 4, and flatlining net income (growth of under 10%, which doesn’t sound so “flatlining” to me), and then he looks for “the ribbon” — which is a chart indicating that the short-term and long-term moving averages are converging.
He says that he’s limiting signups to 500 people at the moment, so gee whiz you’d better hurry, and is selling the service at $2,150 a year, which is only a million dollars a year if he hits his target — you could surely make a lot more than that if you are 94.5% accurate with high-leverage options trades and have a bit of capital to start with.
Is he really good at it? I don’t know, and it’s a brand new service where most of his claims seem to be based on backtesting, so subscribers haven’t had much of a chance yet to see how it works in the real world with real money. My guess is that without a pronounced downtrend in the market, these hits are not quite as predictable in the short term as the ad implies — and the short term is what matters with options, since you’re generally going either a few months or, at most 18-20 months out (less than that for the smallest stocks, which generally don’t have LEAP options).
If this kind of strategy works in the long run, it would very likely require a pretty substantial amount of discipline and diversification — meaning you’d have to keep buying put options even if they lose money, and do so on at least a dozen or so companies, which means your portfolio has to be big enough to have a dozen or so rolling options trades, at perhaps $500 each at a minimum if you want to minimize commissions, still be a small part of your equity exposure… and be something that can perform terribly for several months in a row without you giving up on the strategy.
I did a quick screen in YCharts using his criteria — I didn’t use “low quarterly income growth” as a criteria, because that cut the results too deeply and I was left with only two results (many of these don’t have any income), but here are the 23 results of that screen:
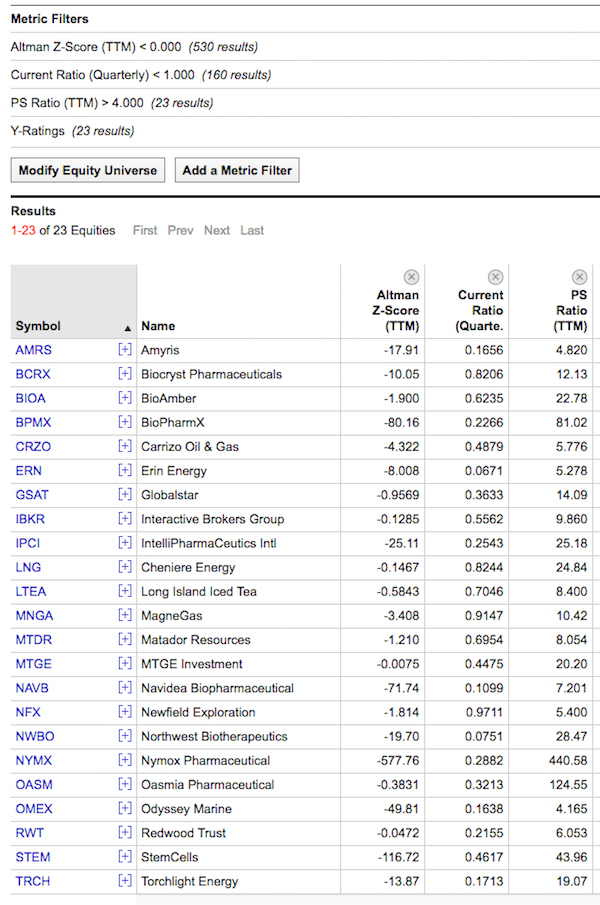
About a half dozen of those don’t have options trading, but most of them do… though several are down at penny-level stock prices and have already been beaten down, so there may not be a lot more options profit to wring out of them on the short side…. many stocks can limp along for a long time without actually going to zero. That list will change every day, of course, but it’s not a bad place to look for weak stocks. I didn’t check to see if their moving averages are converging.
He does provide teaser hints about a couple trades he has actually recommended, so let’s look at those:
“I’ve just identified two companies in the energy sector…
“Based on my criteria, they have a 94.5% chance of dropping in price.
“These statistics are based on 15 years of quantitative data…
“The energy sector is the worst performing industry right now…
“And these two stocks are smack dab in the middle of a 100-foot tsunami.”
OK, hard to argue with that — though I guess things have improved for energy stocks a little bit since this ad was pulled together a month or two ago. Do we get some more specifics?
“The first stock is a major installer of renewable energy products across America. Unfortunately it’s also run by a bunch of scatterbrains who just spent $457 million “marketing” their goods – and LOST $768 million for the year.”
That’s SolarCity (SCTY), and those are the full year 2015 numbers. The Z-score did go negative about a year and a half ago, and it has kept falling — it’s now at -1.12, and, as you would probably expect if you follow the solar installers, the other numbers look pretty terrible as well (though the price/sales ratio is slightly under 4 now because the price has fallen, so it didn’t make my screen).
If this recommendation was made in the last month or two, that means it was made after Tesla’s (TSLA) offer to buy SCTY for about $25 a share in TSLA stock. It’s been a hotly-debated acquisition, largely because Elon Musk effectively controls both companies and they’re both burning so much cash with their ambitious growth strategies, but the acquisition will come up for a vote on November 17. So what will happen with the shares?
Well, it’s a stock deal, not a cash deal, so if it goes through SCTY shareholders would wind up with shares of Tesla worth somewhere in the $24-25 range per SCTY share at current Tesla prices. So if we assume that TSLA stays roughly where it is (of which there is no guarantee), that’s roughly 25% upside.
If the deal doesn’t go through, or if Tesla shares fall, will it drop substantially more? I don’t know. It’s certainly not a company I’d want to buy shares of, either alone or through Tesla.
What would it cost to bet on SCTY falling further?
That depends on how far you want to go out — SCTY does have LEAP options, so you could go out to January 2018 and buy the $10 put options, which means you buy the right to sell SCTY shares for $10 anytime between now and that expiration date in about 15 months. Those options now are priced at about $2, so in order for the trade to be profitable at expiration you’d need the shares to fall to $8 or below… though, of course, if you see the shares spike lower in the next few months it’s likely that put option will rise in value, so you could sell it well before expiration if you wanted to. But that would require a 60% fall in the shares in 15 months to be an “in the money” options trade at expiration. (You could even go to January 2019 if you wanted with SCTY, though that LEAP option just started trading and there’s no real open interest yet).
There are some big pockets of open interest in puts at $15 in both April 2017 and January 2019, for whatever that’s worth, but I don’t know precisely what contract he might have recommended. There is also a heavy short interest in SCTY, at 40% of float, despite the pending TSLA acquisition… so certainly Lewitt is not alone in being pessimistic about this deal (usually you see a large short position going into an acquisition, but it’s typically the acquirer that’s shorted by folks trying to squeeze out the merger arbitrage — so this tells us both that investors hate the deal, which we already knew, and that there’s probably some strong likelihood of it failing).
(If you’re wondering what “open interest” means, that’s just the number of options contracts that exist at that expiration date and strike price for that particular stock — when you “buy to open” a new options contract, open interest pops up by one, when you “sell to close” it drops by one. The volume is the number of contracts of that strike and expiration that have traded on that particular day.)
And what’s the other one?
“The second stock I’ve been eyeing is regarded as a savior for the U.S. natural gas industry. However, the company’s future plans will leave it with $30 billion in debt.
“It will also be on the hook for about $2 billion in interest payments each year and its equipment will depreciate by about $1 billion annually.
“It has a:
NEGATIVE Z-Score of -0.10…
A DANGEROUS Current Ratio of 0.76…
A FOOLISH Price-to-Sales Ratio of 28.63…
A FLATLINING Net Income of -10.22%.”
That’s Cheniere (LNG), which did make our screen… and which has staged a bit of a recovery from the sharp drop earlier this year but is still not a particularly healthy looking company on the financial statements. You probably remember that we’ve covered this one before, it was teased as the “fifth greatest trade of all time” (on the long side) by Dave Fessler for his Oxford Club newsletter last November, and continually pushed for a few months after that.
The stock ran up dramatically in 2014, as they moved forward building their LNG export terminal and everyone was excited about how they were going to profit from arbitraging US and Japanese LNG prices, and then fell through 2015 as delays and huge costs emerged and as skepticism ramped up about how fast they could grow and what the margins might be for the business in future years (since import prices for LNG in their customer countries were falling), and there were public fights about the company’s prospects from some of the most notable investors in the country (Seth Klarmann and Carl Icahn on the long side, Jim Chanos on the short side).
Right now, after bottoming out around $25 during the winter swoon and building back up to $40, the stock still has a meaningful short ratio (10% or so) and put options are still fairly pricey — the big outlier for a contract that has a large open interest and is more than a couple months out is the January 2018 $20 put option, so that would be my best guess for what Lewitt is targeting here — that’s priced at about $1.30 a share, and that means you’re betting on LNG being roughly cut in half over the next 15 months (it’s near $40 now). To keep this trade profitable, you probably need the shares to lose a couple dollars a month pretty steadily to keep options prices high enough… or you need an abrupt crash.
Both are possible, and I’d much rather bet against than for LNG because of the huge leverage they carry (the billions they borrowed to build their LNG trains) against the uncertainty of future profit margins, but I don’t know what the probabilities are. Your maximum profit, should LNG go to zero in 15 months, would be about $18.50 a share from a $1.30 investment — so that’s pretty exciting, but it’s possible (I can’t really tell from the examples) that this system would recommend taking some profits on a swoon in LNG shares that drives put option prices up, then re-buying a further-out put option to bet on continued decline.
So there you have it — one example of the opportunistic put-buying newsletters that have emerged in recent months, and a couple of the stocks it’s currently teasing in its ads.
I’m going to leave it there, because I’ve gone on too long already — but if you have questions or comments about strategies for hedging or betting against stocks or the market, or other ideas you’d like to share, please feel free to chime in with a comment below. Thanks, and enjoy your weekend!
What do you think of Harry Dent’s prediction that deflation will cause gold to fall to $750 per ounce in 2017 on its way to $250 an ounce in 2021?
He’s basing that largely on demographic shifts — people retiring and spending their savings instead of being productive, which will impact all parts of the economy. I don’t know if he’s right or not, I like good because of it’s historic ability to protect spending power over very long periods of time but I don’t pretend that this means good will be guaranteed to move predictably during any particular decade… which is why I have a portion of my portfolio in gold stocks and a portion of my savings in gold and silver coins, but I don’t let that total exposure get up much above 15 percent of my assets.
So you think 15% of your assets is a reasonable percentage to own either gold or gold/silver mining stocks? I noticed you seem to like Altius minerals. Do you still hold that? What other mining or royalty stocks do you hold?
Hi Paul,
one way to find out more about Travis’s personal portfolio is to join the irregulars…best dollars I have spent in a long time…
this is tom again…. yes i have some pm stocks
(nem) (slw)
( tgldx)….. they are all gold or silver stocks
he’s right about having physical gold, but wrong on paper gold. When the bubble bursts the paper then is worthless, only physical gold will survive, please tell him if you can’t hold it in your hands you don’t own it
Dent made the prediction for 2016. So I guess he is extending his prognostication for a another year. We only have 90 days to see if the 2016 prediction was right or wrong.
One of the other hard-money-camp guys offered him a bet he would be wrong, but I don’t know if the bet was consummated.
Dent could be right. He went to Harvard, you know. (The Harvard guys are always sure to tell you that in the first five minutes.)
I am inclined to think the odds are against this prediction, but one never knows.
He’s moved it a few times… portable goal posts.
http://www.kitco.com/commentaries/2016-02-11/Will-Harry-Dent-Eat-Crow-on-His-700-Gold-Price-Prediction.html
Dent is a permanent member of the “sky is falling” camp. Weiss Research is another. I tried one of his option trading services a long time ago. If I recall correctly, all the recos were puts. I opened an account with Optionsexpress (which has since been acquired by Schwab) because Weiss had an autotrading arrangement with them: Optionsexpress would open and close every trade as soon as they received instructions to do so from Weiss. A $5K account set to trade only 1 option per reco went to zero in no time.
of course there has to be another side, but he is wrong, very wrong and we will see very soon, but don’t tell anyone I told you so.
Great analysis. I decided to take the plunge to become a member of ZTC. So far, it’s pretty much as you said, but here were the actual recommendations on the teased stocks, if it helps:
SCTY: But JAN17 $5 PUTs at 0.50 limit
LNG: Buy DEC16 $30 PUTs at 0.50 limit
Hope that helps. 🙂
=^=
Ah, interesting that he’s going shorter term and somewhat closer strike — much lower cost per trade. I wonder where the anomalous open interest in some of those LEAPs is coming from, with that concentration there’s a good chance that it’s a different newsletter or trading service.
I can confirm trekon’s trade because I took the same trades from ZTC. LNG is up 50% now but SCTY is a hopeless 75% loss. After 6 weeks I got my fee refunded and I’m glad I’m out. So far his ratio of losses is equal to the wins, therefore no joy is here IMHO.
I also pulled out. Lost much more than won, much more. Negative on this one.
Travis in my opinion this is the best piece you have written since I have been an irregular. You are one of a very small number who see that the great depression was caused indirectly by the Great War,,, WW1 ,,,that led to a rapid mechanization of the nation and especially on the farm which caused huge overproduction that needed much less labor.
In my view the price of gold is a relative constant and all we here care about is how the Dollar fluctuates , in how many Dollars it takes to buy an oz.
There is a new factor however in that gold is traded on the FX market and open to multitudes of small investors which may upset the plans of the major movers and manipulators of prices. Which way?
Any answer could only be a guess as so many variables are now present all old models have flaws. imo
Hi Travis, any chance you will be talking about what’s going on with Ligand in one of these Friday Files soon? Would like to hear your thoughts, thanks.
Will put that on the list, thanks.
Thoughts on Deflation, Hedging and Gold – Brilliant piece and analysis by Travis.
include SKEW score in weekly letters
Hi jimbee, the SKEW chart using CBOE data is available from most charting platforms.
post Skew scores weekly
Hi Travis, I always enjoy and learn something from your Friday Files. Your sensible and rational commentary is a breath of fresh air among the usual punditory fog. This Friday’s reminded me that Stansberry is touting a new service called the “Big Trade” in which they propose to select 30 companies with abysmal financials and recommend out-of-the money LEAP Puts, in order to profit from the expected popping of the new debt bubble. To be successful they have to be right four times: choice of company, choice of option, timing of purchase, and purchase price. Rather than selecting 1-3 stocks that have to hit the bullseye, they are picking 30, so as you said above they really only need to hit the target with some of them to come out ahead. It is much too expensive for my blood: $5000 for 5 years. But I am interested to know if you or any of your irregulars have any thoughts?
At that price, he can gross $10 million with only a couple thousand subscribers, so I doubt he cares if he’s right. These guys must sit around in their marketing meetings dreaming these things up and having a great laugh over the naivete of the subscribers. If they’re right, they are heroes. If they are wrong, so what’s a few thousand subscribers. If they had any real balls, they would just use their own money to make their fortunes.
Great article. Similar to Z scores is the Forensic Accounting work by John Del Vecchio. He runs HDGE, a short fund, and FLAG a long short fund that he says will come up a little short of the SP500 in the up years, will not drop as much during the down years, but will produce superior returns to the SP500 over time. I am not interested in either fund.
I do like his book a lot. Every Irregular should read it. It is a great intro to Forensic accounting… learning how Management can bend the accounting rules and very hard at times….. and so, he does make short predictions. He will teach you to take financials very seriously and dig into the 10Ks.
https://www.amazon.com/Whats-Behind-Numbers-Financial-Chicanery/dp/0071791973/ref=sr_1_1?ie=UTF8&qid=1476668644&sr=8-1&keywords=john+del+vecchio
I plan to read his next book on how to use in depth financials to find the best of the best:
https://www.amazon.com/Rule-72-Compound-Uncover-Profits/dp/0692721355/ref=sr_1_4?ie=UTF8&qid=1476668644&sr=8-4&keywords=john+del+vecchio
I, too, took the plunge on Zenith Trading.
I subscribed to Rickards Intelligence Triggers for a year but just dropped that as his batting average was no better with his ‘Kissenger Cross” method than any other option service I have tried over the years; i.e., many more losers than winning trades. (Of course, they really tout the winners but try to ignore the losing positions)
The big difference is that Richards uses mostly LEAPs to “allow time for his thesis to be right”, which means he doesn’t have a lot of short term confidence in his plays. This makes his reco’s very expensive, often $8-17 ($800-1700 per contract). That’s a lot to bet on one position, then watch your time value erode while waiting.
Zenith is the exact opposite approach. Michael uses out the money near term (3-4 mths) puts. The most expensive one he has recommended so far is 80¢ or $80 per contract. This is much more doable for me. He plans to take quick profits and then buy puts on the same co. again in 2-4 mths., what he calls ‘carbon trading’.
So far the first three weeks, 5 of his 6 reco’s are in positive territory.
Travis, you did nail one more of Michael’s recos on your list, NYMOX Pharma. He went out the furthest out on this one, still only to Feb. 2017.
Check the record now. 4 of 1st 6 trades are down. 1 is flat. 1 is up 20%. And that is if you bought at his alleged “recorded price.” Almost no one can get in at this price. The last one was SHLD Jan 2017 $5 puts. He claims it could have been bought @ $0.20. Out of the 29,022 contracts that traded that day 100 traded at $.020. Those 100 contracts were traded @ $0.20 at 1:14 pm ET. That’s the same time I received my txt alert. You then have to check your email for the trade info and get your trade entered. No human can do that in under 1 minute. You are given a limit price but if you buy anywhere near that price you will loose money. I have made 8 trades and I am down in all but one. I have lost 50% overall on the 8 trades.
I agree completely with your analysis-I cancelled my subscription to Zenith Trading Circle before the 90 day trial period was up. I lost more than 50%, as there really was but one winner out of the lot of 10 trades due to exactly what you mentioned-inability to get any way near to his record price for the options recommended as well as 90% of the put options underperforming in this rising market since October 2016.
well when buying puts sometimes the deep in the money ones have a much lower time value and will more or less move with the stock but you have to invest a lot more money. out of the money puts are cheaper but generally have a much higher time value and for them to have gain they would not only have to move in your direction aka stock price approaching the put strike price but also have to decline faster than the time value decay. Mike L, seems to have a knack to balance these puts and probability of them having a gain within the expiration time.
Wow, Travis. Really enjoyed your rant. Just starting to dip my toes into the options trading world. Have come to depend on this site knowledge. Best $ I ever spent becoming an Irregulatr.
Thanks!
Lewitt recommends out of the money puts. Stocks don’t fall as precipitously as he suggests. You can better preserve capital by buying in the money puts and rolling positions forward with the stock price decline
I’ve followed Lewitt for a while and even went after some of his suggestions (DB, SHLD, VRX). first all were losers of $$$ (2-50%, 1-25%). second he does use OTM longterm options for his “suggested plays”. You will never make good this way…. if you believe his suggestions, then ITM puts would be the only logical way for the drop in stock price to reach you. VRX was at 22 and dropped to 15… and this was the 25% loser!!! if you’d been ITM then you would’ve made something instead of losing.
Summary: he is NOT a trader
Forget the “Blow Hard” Lewitt and his expensive options service . Here is an option from “The Mystery Options Man” or M.O.M . Simply BUY the SWHC ( Smith & Wesson ) March 17th , 2017 $22 CALLS . Make some cash , and buy someone something nice for Christmas . Free Advice From MOM!
I joined and followed his first 9 recommendations. 2 x DB, ECA, LNG, MTDR, GLNG, SCTY, TSLA and VRX. I was up about 50% in TSLA almost immediately but with no sell signal from him I held and watched the profit disappear. He bought back the DB’s at a loss and rolled them out at a higher SP as though this was some great maneuver but it just lost more money. Luckily by this time I had realized he was full of crap and did not follow along. Every stock he recommended that was supposed to plunge has gone up in price and I will probably lose over $6000 on his recommendations. They did give me a very prompt refund when I told them he was full of crap. He sucked me in with his “ribbon” where a combination of different MAs is supposed to flip over just before the plunge. He never mentioned this again in any of his recommendations. He just knew that theoretically at some point the stocks would drop because of bad fundamentals but really had no idea of when. Buying puts with are depreciating assets is a great way to lose money as I’ve found out once again. I was a fool to be sucked in by his “ribbon” timing method.
I lost money on EVERY put option he recommended – tried to be conservative and limit each position to between $150 and $250 but still lost about $3k. He apparently had 2 profitable recommendations in December (right when I was getting out of it but didn’t want to stick my neck out anymore) which I think were GoPro and maybe sears??? I think some people made a little money of Nymox when he recommended closing half a position. I’m still holding one single $160 March Tesla put and I think a $200 dollar May CMG put – and have lost $500 on each of them since his recommendation. His DB puts are looking rough (but who knows with DB). It was a total disaster. I did receive a full refund. He recently flip flopped on his views of the market and economy – from calling for the ‘super crash’ in 2016 to saying there is almost nothing that can stop this bull market in 2017. Michael Lewitt talks about how the media has lost all credibility???? HA!! Save your money. I followed this guy for well over a year before I learned that he simply does not the tiniest understanding of the markets. Hope people can learn from my mistake.
I got out of Zenith in late January. Way too many losses. If I bet the opposite way, would have been way ahead! Hmmm?